> ## Documentation Index
> Fetch the complete documentation index at: https://larkup.de/documentation/llms.txt
> Use this file to discover all available pages before exploring further.
# Analyze Tabular Data
> Upload a spreadsheet or CSV and ask analytical questions. Larkup returns charts and summaries directly in Chat.
Larkup understands structured data. Upload an Excel or CSV file and the AI can aggregate rows, compute totals, compare categories, and render the result as a bar chart, line chart, or table inside the Chat conversation.
## Loading the data
Go to **Data → Files** and drag in your `.xlsx`, `.csv`, or `.json` file. Larkup detects the structure automatically. Column types, row count, and the data schema are shown before you confirm.
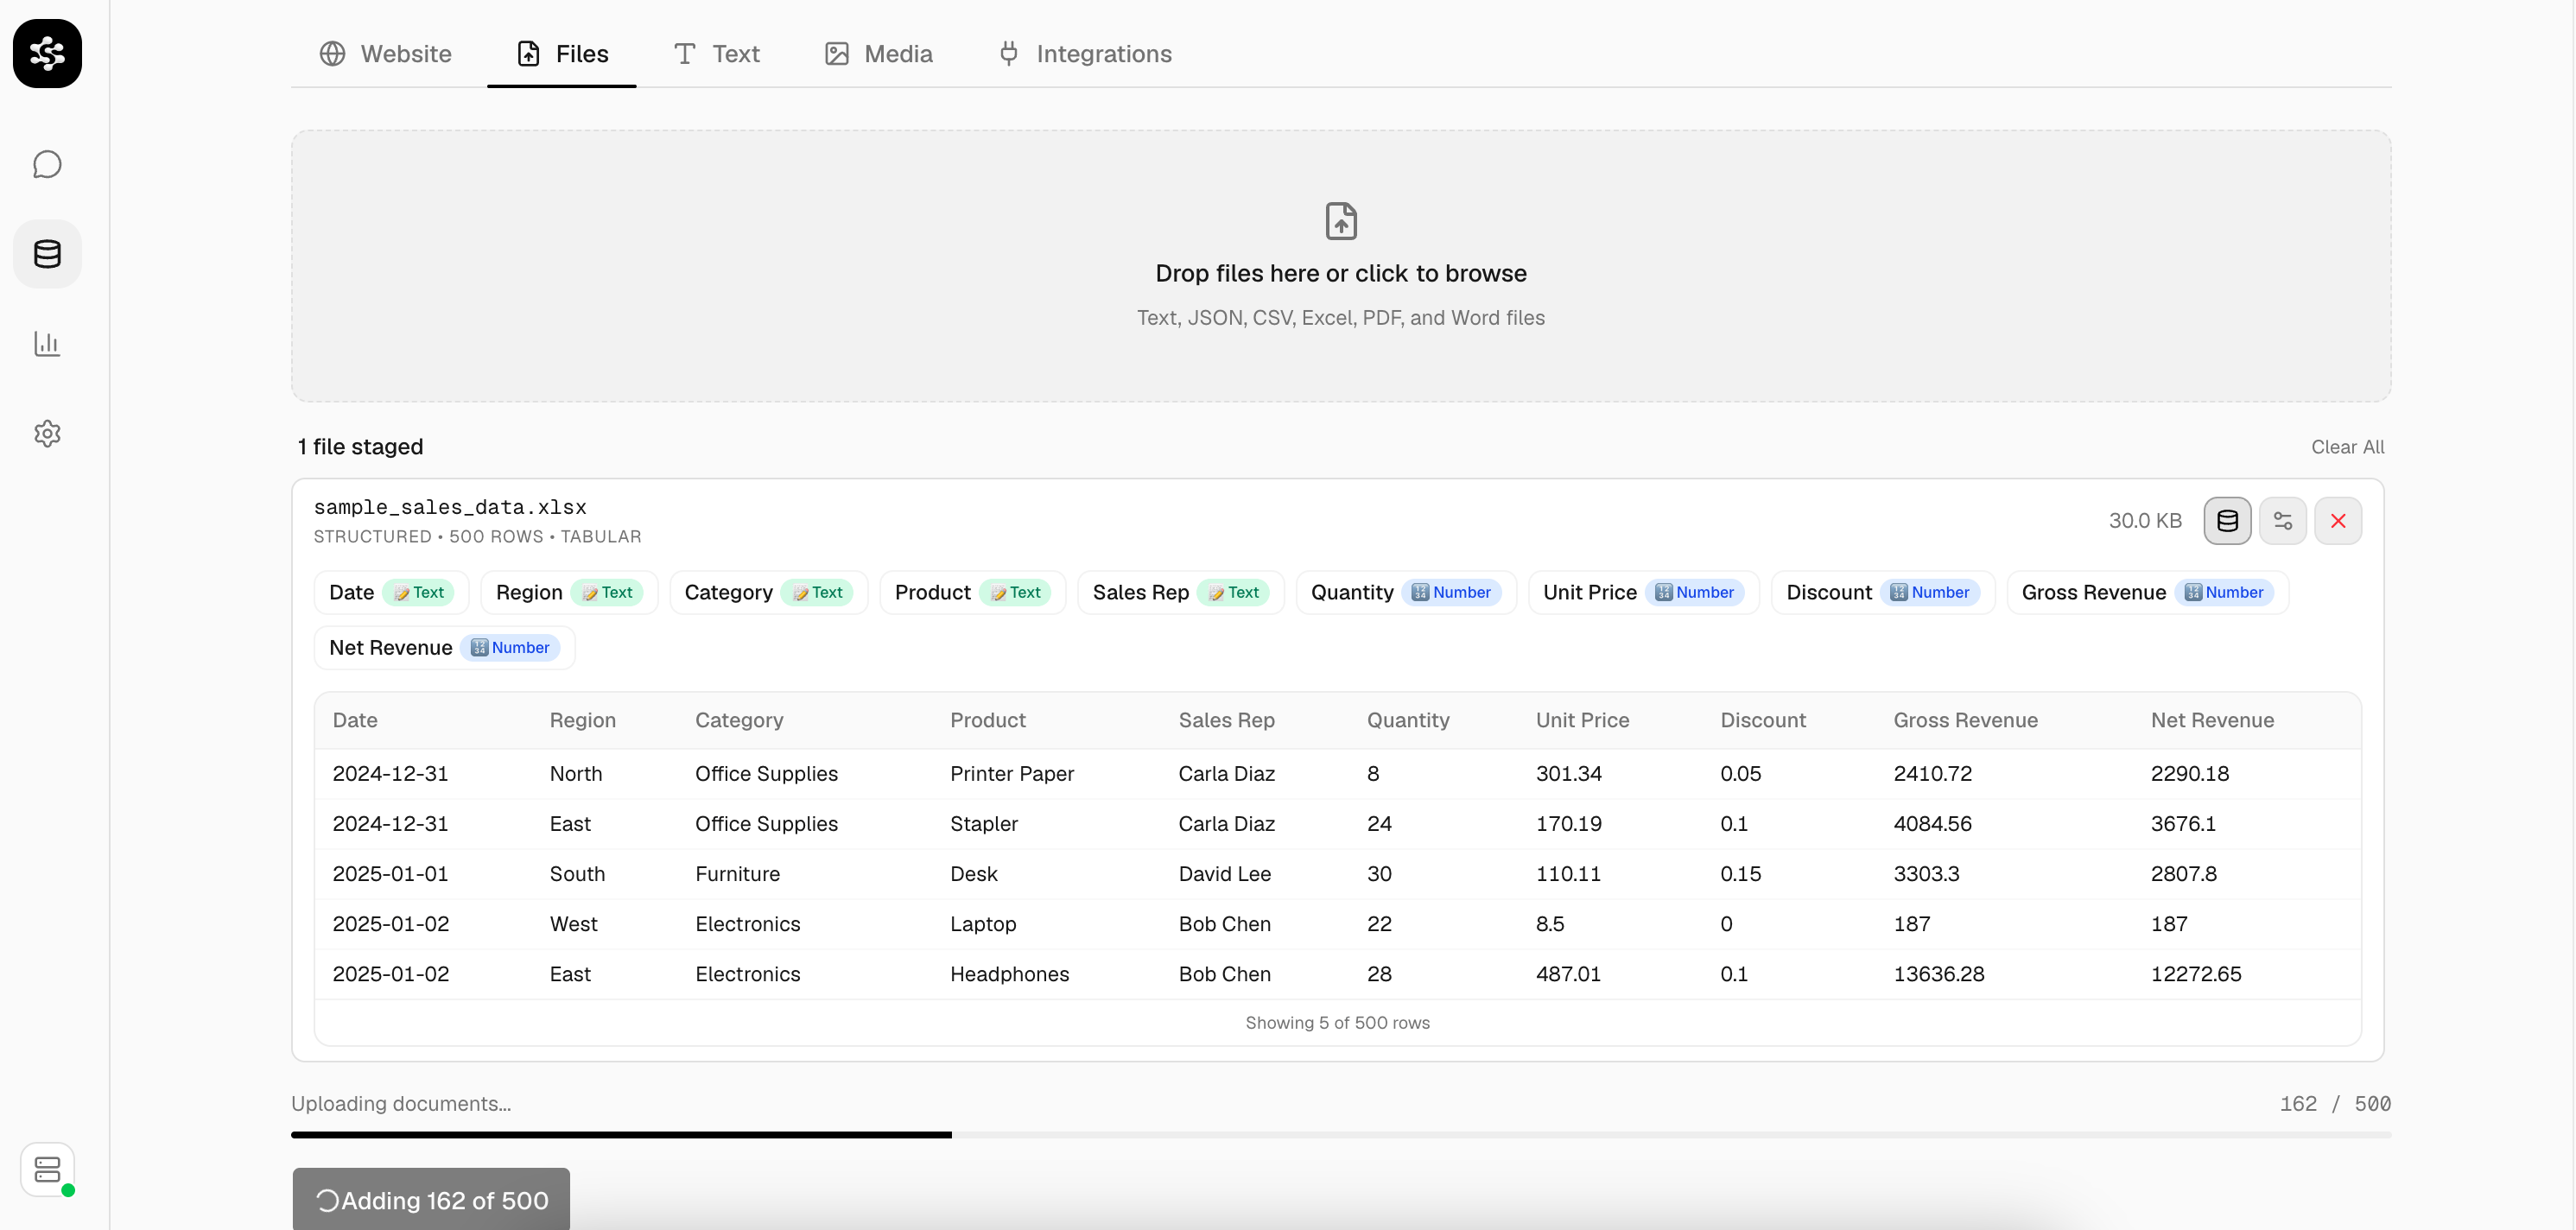
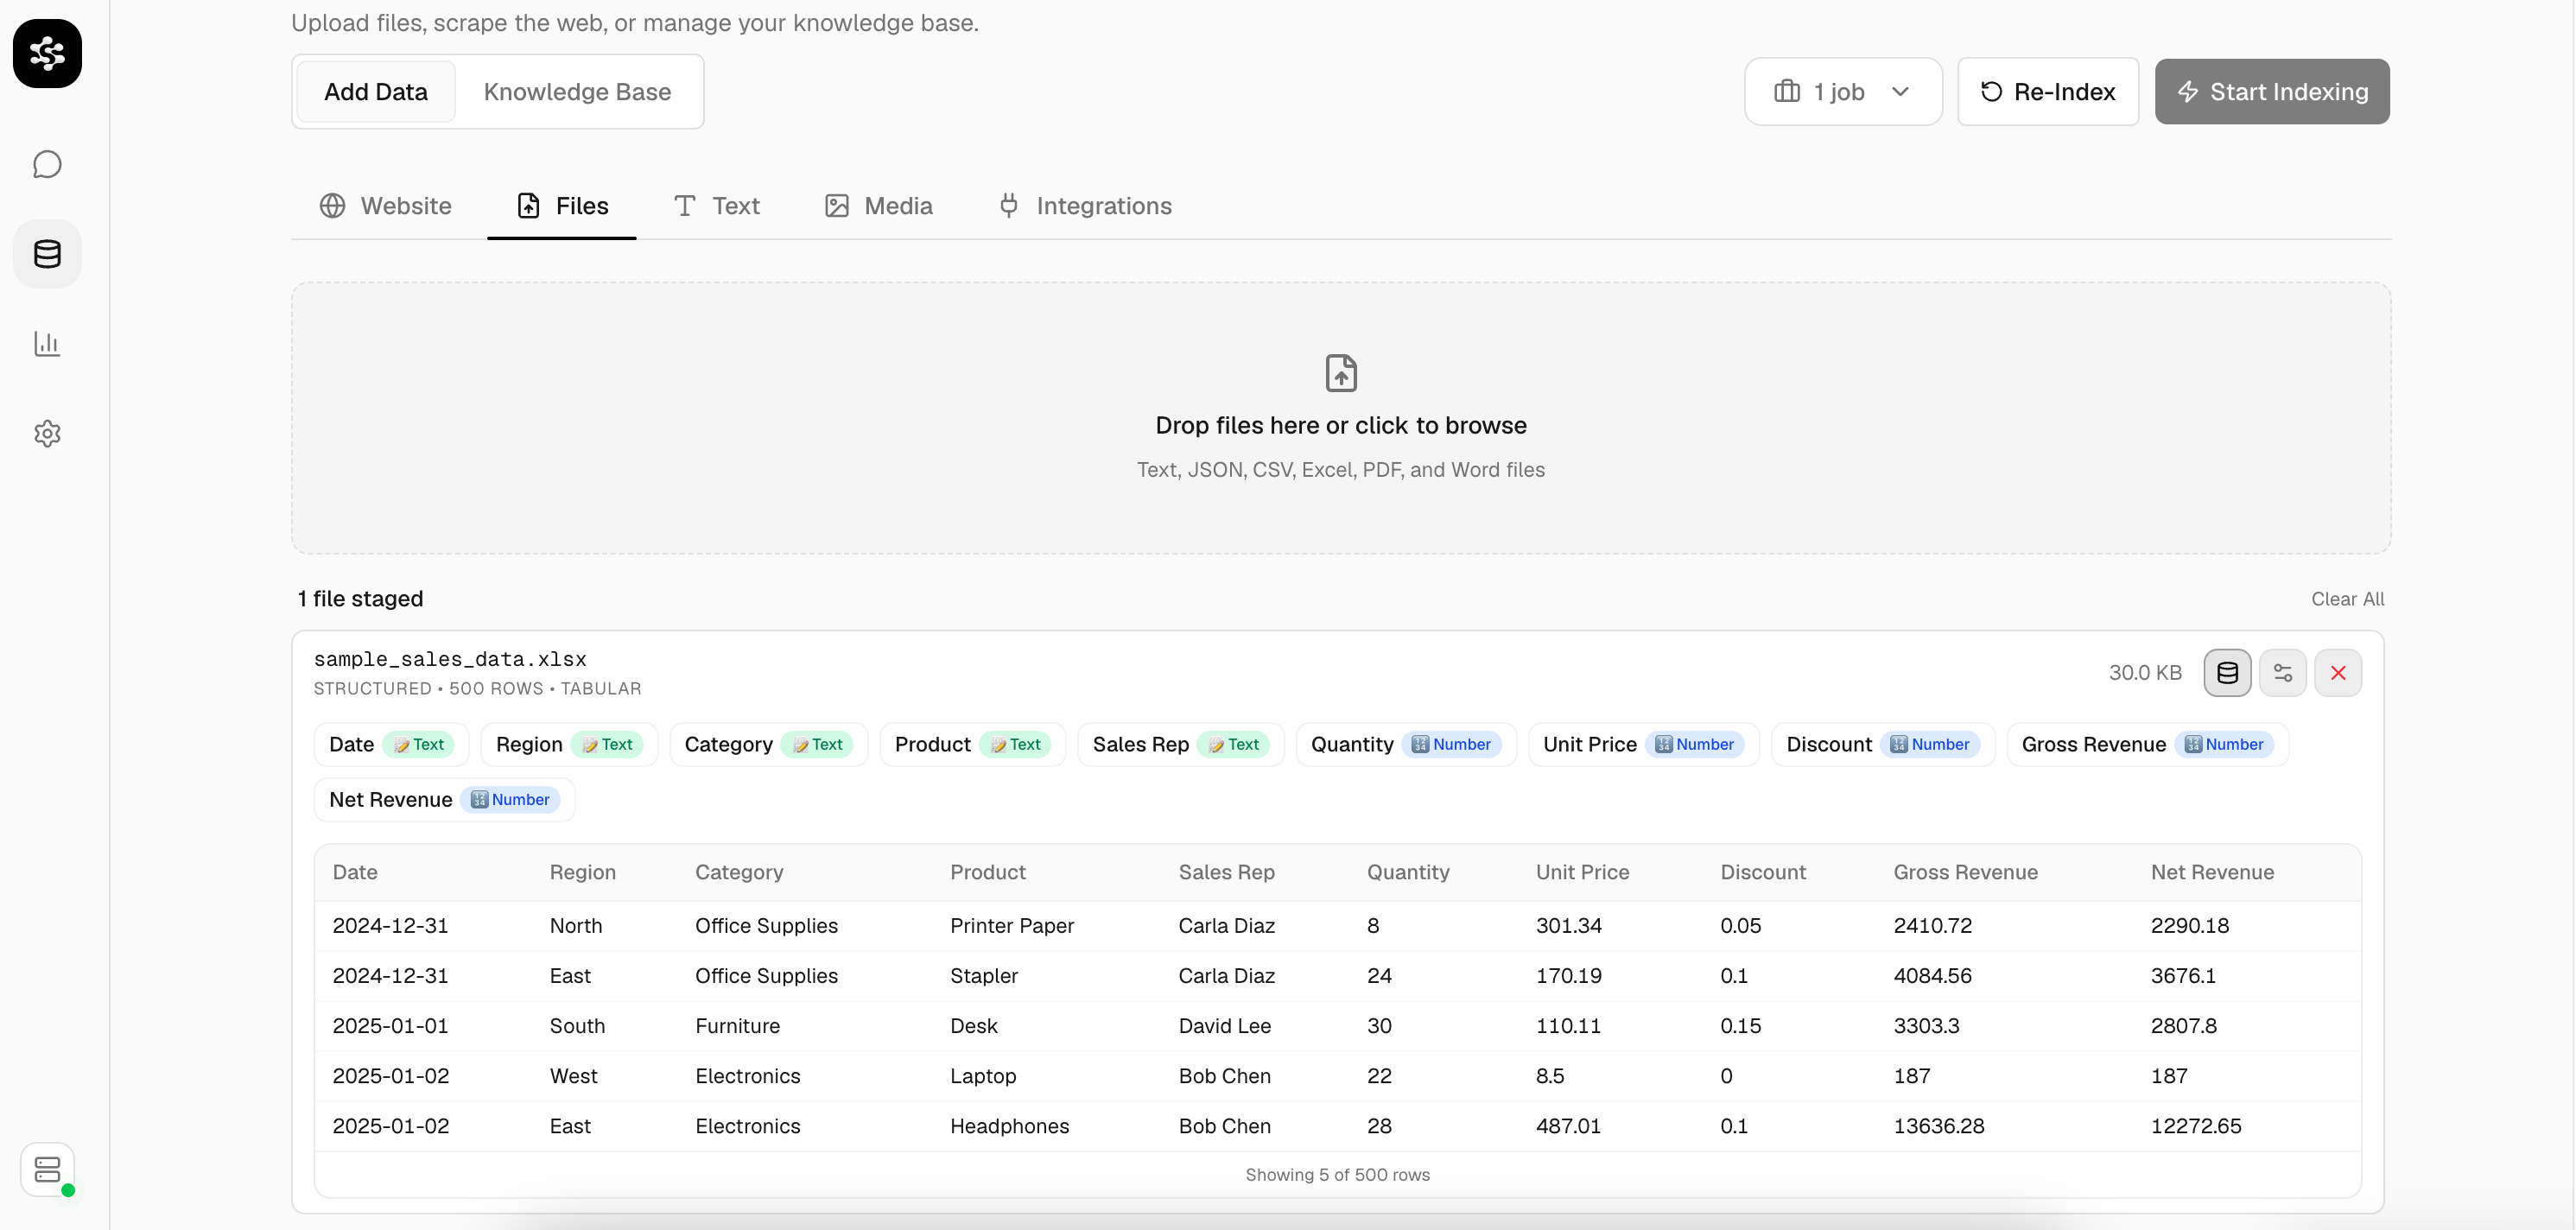 Click **Start Indexing** to begin. Progress is shown in real time.
 ## Asking analytical questions
Once indexed, open **Chat** and ask anything about the data:
> "Show revenue by region as a bar chart"
>
> "Which sales rep had the highest net revenue in Q1?"
> "Give me a monthly breakdown of gross sales"
Larkup reads the relevant rows, computes the answer, and renders the chart or table inline.
## Asking analytical questions
Once indexed, open **Chat** and ask anything about the data:
> "Show revenue by region as a bar chart"
>
> "Which sales rep had the highest net revenue in Q1?"
> "Give me a monthly breakdown of gross sales"
Larkup reads the relevant rows, computes the answer, and renders the chart or table inline.
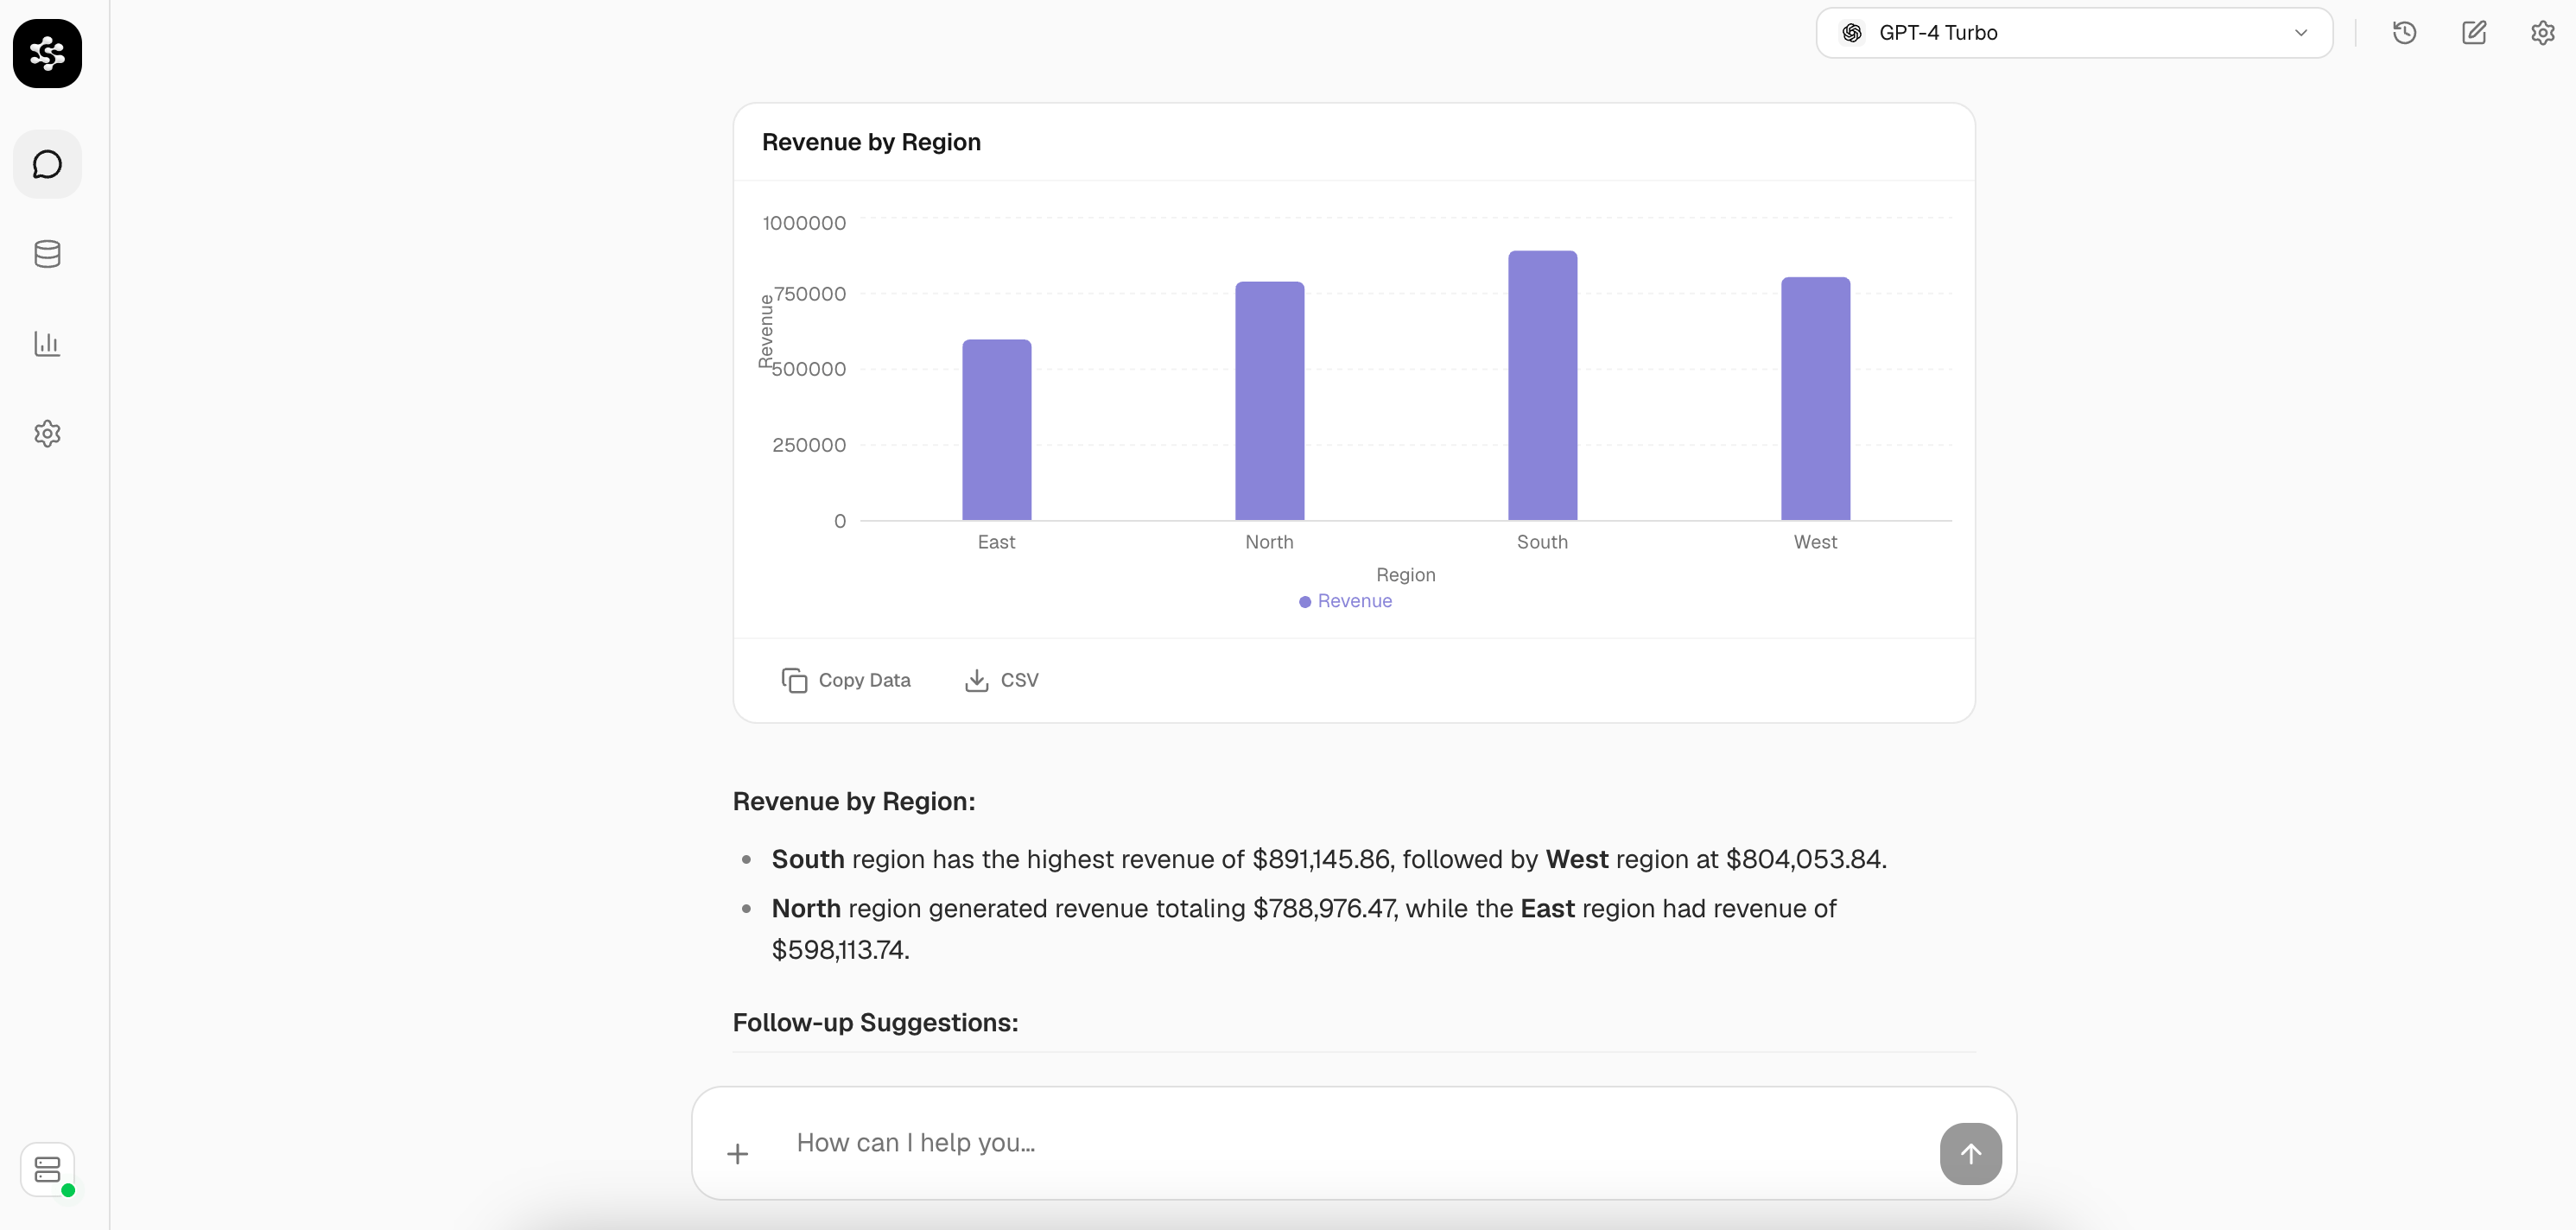
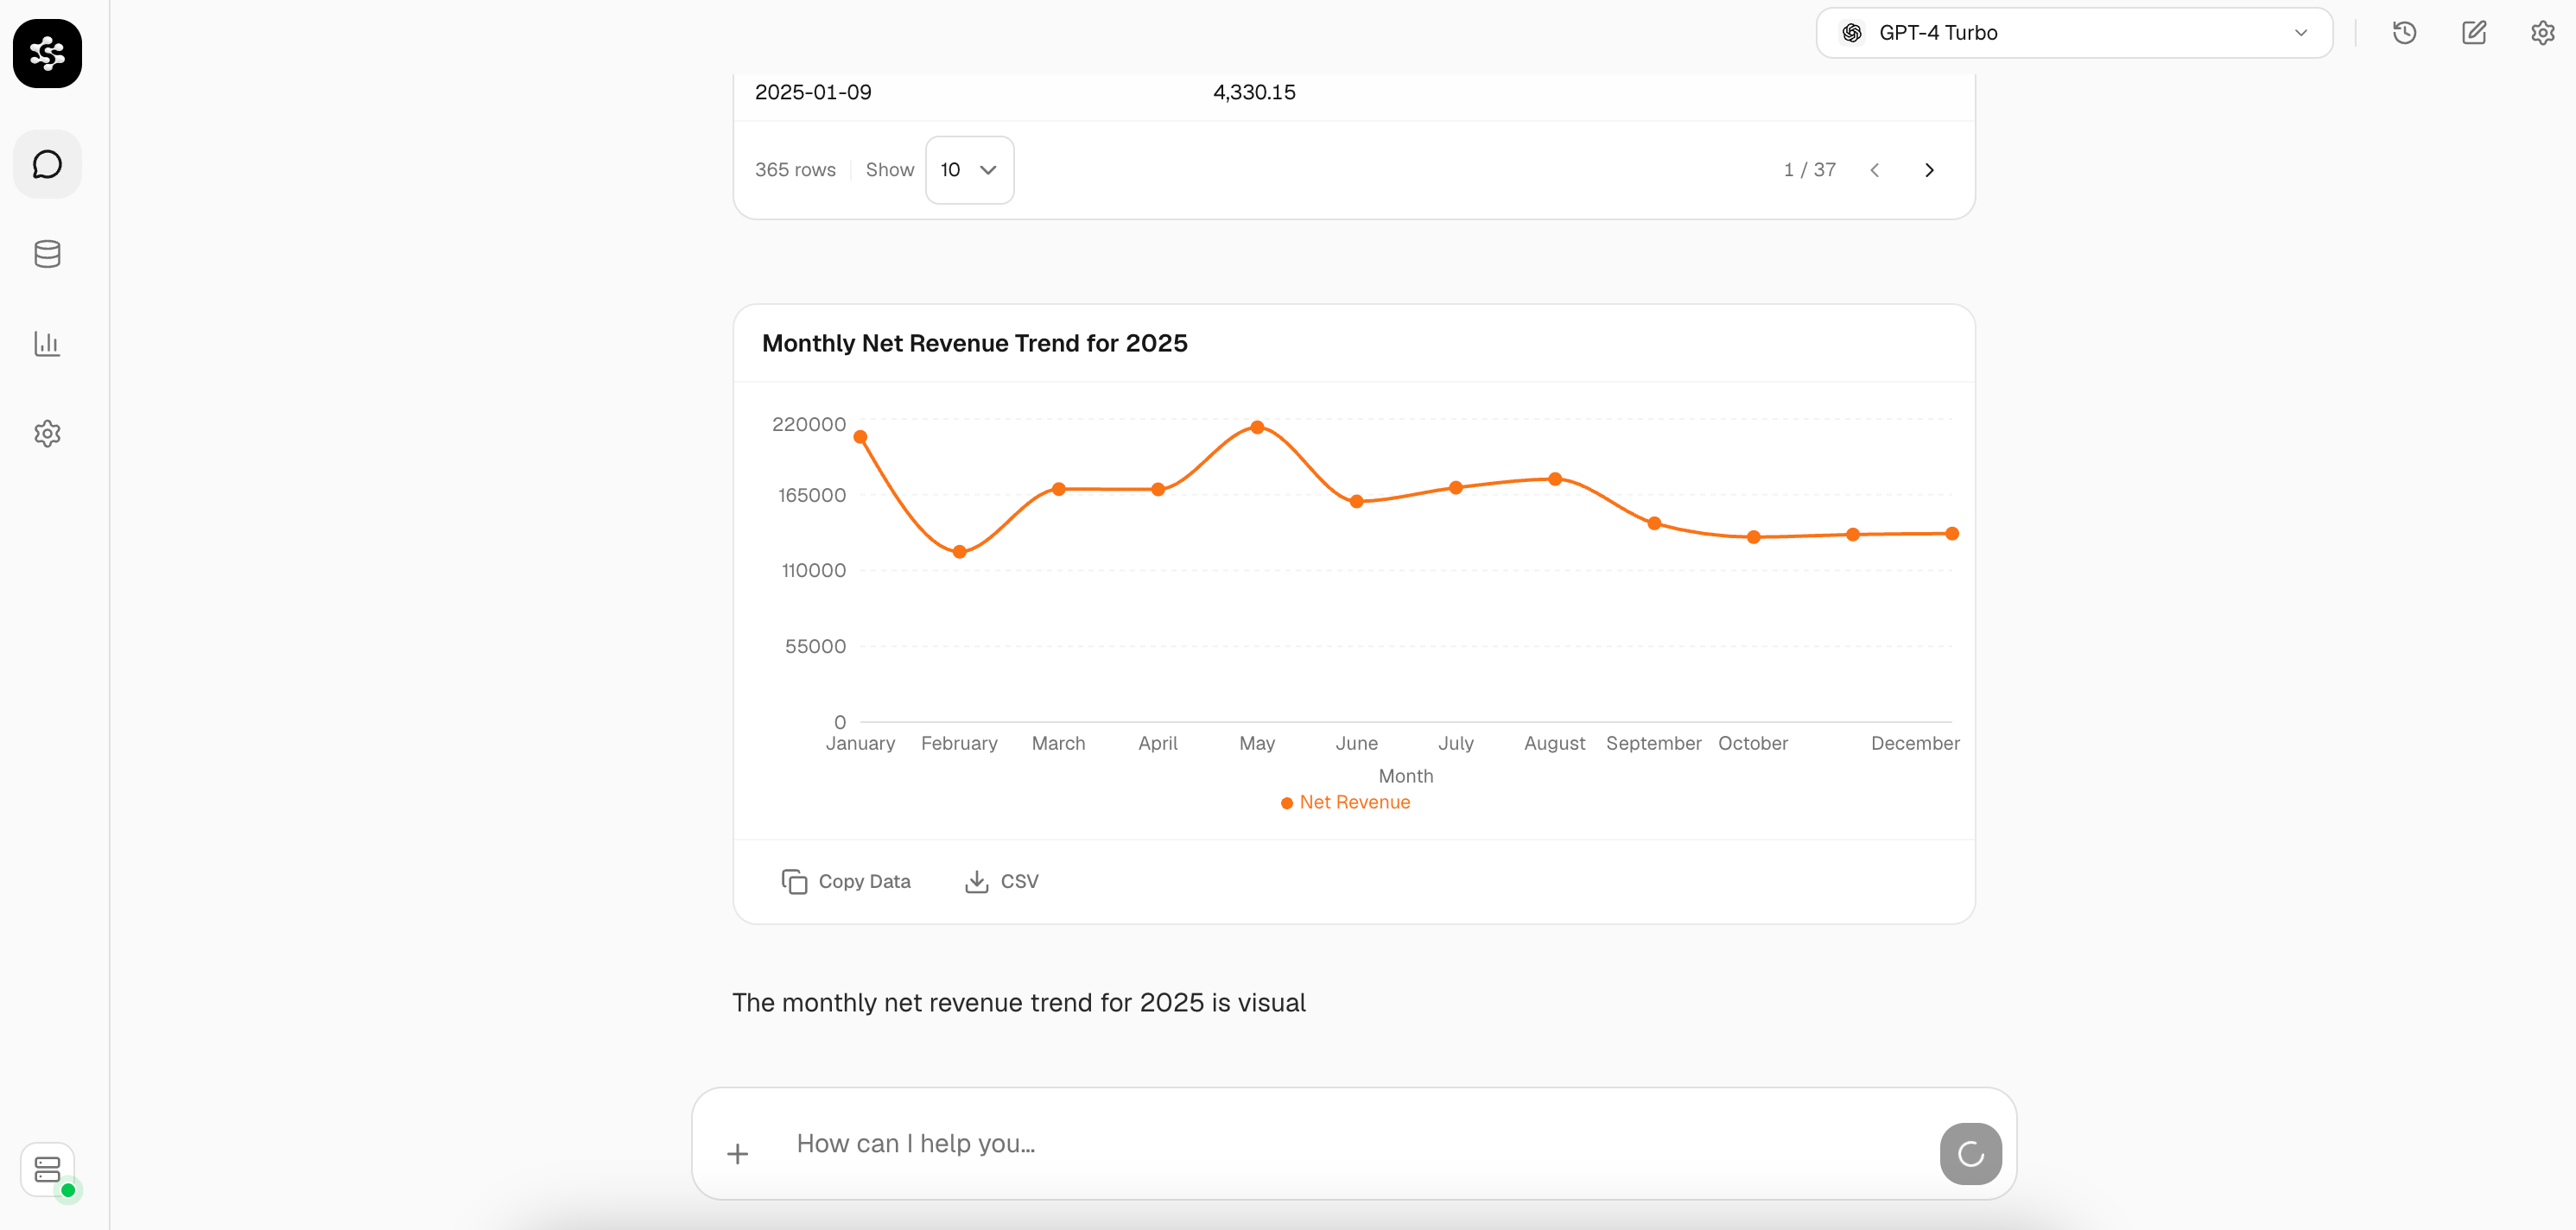 Each chart response includes a **Copy Data** button and a **CSV** export so you can take the output into another tool. Later questions build on the previous answer. You can drill down into a specific category, change the chart type, or ask for a written summary without uploading the data again.